How reliable is Harbour's output today, and has that changed as the process grew?
In September about one merged PR in six was followed by a Bug ticket reporting a fault in
shipped behaviour: 17.2 per 100 across both repos. That was 13.7 escaped defects per 100
merged PRs in LinearViewer (Harbour) and 43.6 in simple-dispatcher, against 5.4 and 12.2 in
June when the fleet started. So the count has risen with the process. In LinearViewer that
rise is a change in who finds faults and files them, not a change in how many are made:
without the residue below, September is 5.7 per 100, level with June. simple-dispatcher's
September rise is only partly explained that way. Since August the fleet's own reviews,
research and close-outs find faults in older code and file them as follow-ups: at least 67
of the 103 August–September escapes, 47 of them labelled kind:review-residue. Before July
the operator found most escapes. By August agents found nearly all of them. Where a Bug
names the ticket that wrote or exposed the fault, the fault surfaces within days (median
about 4). The rate climbs weakly with change size, and more gates come with neither fewer
nor more escapes. Code review stops a comparable number of bugs before merge: an estimated
35–45% of the bugs visible from June to September never reached main, though the data allow
anything from about a quarter to about two-thirds. Everything git sees is quiet: red CI on
main on 4.6% of runs in June and about 1% since, three reverts all year (none of them for a
defect) and no hotfix PRs.
Findings
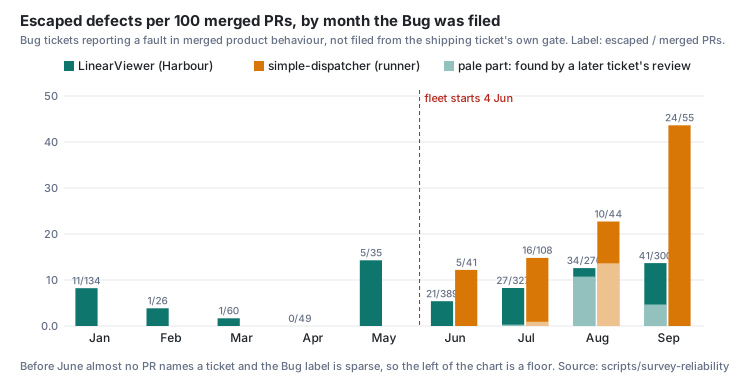
Escaped defects per 100 merged PRs rose after the fleet started, in both repos. A Bug counts as escaped when it reports a fault in behaviour already on main (code, prompt text, config or UI) and was not filed from the review or close-out of the ticket that shipped it. 265 Bug tickets were read, of which 190 are escaped, 39 routed, 11 test-only, 23 not a defect and 2 unclear. Counted in the month the Bug was filed:
| Month | LinearViewer (Harbour) | per 100 PRs | simple-dispatcher | per 100 PRs |
|---|---|---|---|---|
| Jan | 11 / 134 | 8.2 | — | — |
| Feb–Apr | 2 / 135 | 1.5 | — | — |
| May | 5 / 35 | 14.3 | — | — |
| Jun | 21 / 389 | 5.4 | 5 / 41 | 12.2 |
| Jul | 27 / 327 | 8.3 | 16 / 108 | 14.8 |
| Aug | 34 / 270 | 12.6 | 10 / 44 | 22.7 |
| Sep | 41 / 300 | 13.7 | 24 / 55 | 43.6 |
Eight Bugs report faults spanning both repos and count in each. simple-dispatcher's rate is the higher one because it merges a fifth as many PRs while carrying the substrate that most Bugs are about (hook, launch, reaper, resume).
Most of the August–September rise is later reviews finding older faults. 33 of August's
42 escapes carry kind:review-residue: a review on another ticket noticed a fault in older
code, left it out of scope and filed it. At least 21 more escapes have the same origin, found
by another ticket's review, research or close-out, but carry no residue label; 11 carry
kind:follow-up. Without all of them, LinearViewer's August is 1.9 per 100 and September
5.7, level with June's 5.4. simple-dispatcher's September holds 9 of them, which leaves 15 of
55: 27.3 per 100, with a 95% interval of 15–45 that overlaps June's 4–29.
Who finds escapes moved the same way. The operator found 10 of January's 11, 18 of June's 26
and 18 of July's 43, but only 2 of August's 42 and 7 of September's 61; agents found the
rest. The labelling moved as well: Bug is 1% of tickets numbered LIN-2000 to LIN-2249 and
15–22% of those from LIN-2250 to LIN-2999. Together these mean the rate measures the
fleet's finding and filing at least as much as the fault rate. A reader cannot separate the
two from this data.
Where the shipping ticket is named, escapes surface fast, and a little more in bigger
changes. 24 of the 190 Bugs name a shipped ticket that wrote or exposed the fault, rather
than one whose review found an older fault and deferred it, and were not filed as residue.
They were filed a median 4.1 days after that ticket's first merge (interquartile range
0.7–10.2), and all within 30 days. Across the 1,310 tickets shipped from June to
September, the rate of these attributed escapes climbs with the lines changed across a
ticket's PRs. This is the same order as ticket-record-and-quality.md's 7 genuine misses in
184 Done tickets (:106-107).
| Ticket size, lines across its PRs | Tickets | With an attributed escape | per 100 |
|---|---|---|---|
| ≤50 | 149 | 1 | 0.7 |
| 51–400 | 677 | 8 | 1.2 |
| >400 | 484 | 12 | 2.5 |
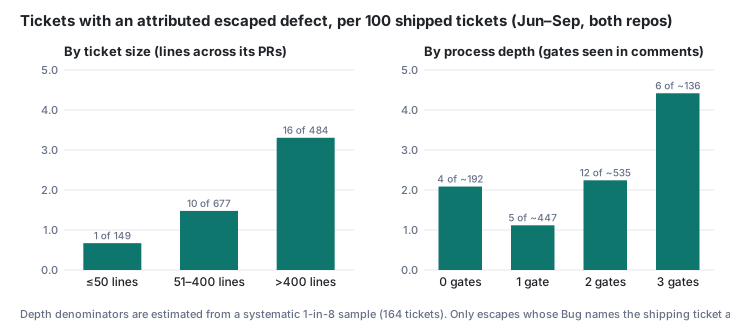
The figure above was drawn for version 1 and still shows its counts (10 and 16 in the upper size bins; 12 and 6 in the upper depth bins). The tables are version 2's.
More gates come with neither fewer nor more escapes. Process depth counts the gates a
ticket's comments show (plan-review, code review, close-out), in a 1-in-8 systematic sample of
shipped tickets (164 from June to September). The rate shows no gradient: 2.1, 1.1, 1.5 and
2.9 per 100 for zero to three gates. This is observational. Gates are given to larger and
riskier work, as ticket-record-and-quality.md found (:169-171), and each depth bucket
holds only 4 to 8 escapes.
| Gates | Sample | Est. tickets | With an attributed escape | per 100 |
|---|---|---|---|---|
| 0 | 24 | ~192 | 4 | 2.1 |
| 1 | 56 | ~447 | 5 | 1.1 |
| 2 | 67 | ~535 | 8 | 1.5 |
| 3 | 17 | ~136 | 4 | 2.9 |
Code review stops roughly as many bugs as escape, but the catches cluster. Of the 164
sampled tickets, 104 went through code review, and 18 of those were sent back with blockers.
The blockers were 24 real bugs, 11 coverage gaps, 11 record corrections, 3 scope and 1
process. Two of the bugs came from a plan review (LIN-2351), not a code review, which leaves 22
in 9 tickets. One credential ticket, LIN-2081, holds 8: PEM handling that rejected working
keys and leaked key material into error messages. That is 21.2 bugs stopped per 100 reviewed
tickets, or 13.6 without LIN-2081, which scales to about 113–176 across the roughly 831
reviewed tickets of June to September. The same months produced 172 escaped Bugs and 39
routed ones. Review therefore stopped an estimated 35–45% of the bugs that are visible at
all. The estimate is soft. Bootstrapping the 104 reviewed tickets gives 25–63%, and counting
tickets with a caught bug rather than findings gives about 27%, since LIN-2081's eight
interlocking findings would not have escaped as eight Bugs. The rest reached main, either unseen (escaped) or seen
and filed (routed). fleet-complexity-read.md (:217-228) shows the same clustering on
LIN-3124: one PR, eight blockers, seven of them bugs.
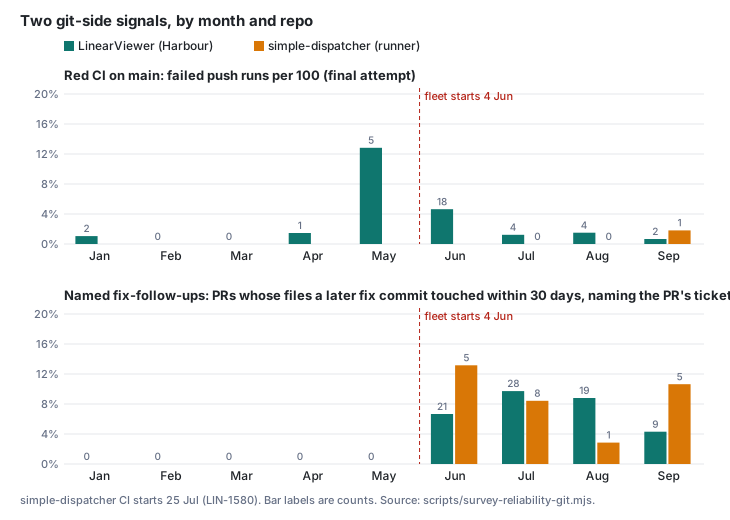
Everything git and CI can see is quiet, and quieter since June. The table below is from
scripts/survey-reliability-git.mjs.
| LinearViewer (Harbour) | simple-dispatcher | |
|---|---|---|
| Red CI on main, final attempt of push runs | Jan–May 8 / 394; Jun 18 / 388; Jul–Sep 10 / 890 | 1 / 107 since CI began on 25 Jul |
| Reverts on main | 3, none for a defect: 20 Jan (a process change), 28 Jun (PR #670, built without its spec), 12 Jul (PR #903, an inert layer) | 0 |
| Hotfix PRs | 0 | 0 |
| Named fix-follow-ups, 30 days, per 100 PRs touching production code | 0 before June; 7, 10, 9, 4 from June to September | 13, 8, 3, 11 from June to September |
June's 18 red runs are the fleet's first month. After it, main is red on about 1% of pushes.
cheap-implementer.md (:103) saw the same on its thirteen merges. A named fix-follow-up
is a later commit on main, within 30 days, that touches one of the PR's production files,
says fix or regression, and whose subject or ticket names the PR's ticket or number. Before
June it is zero because PRs did not name tickets, not because nothing was fixed.
Incidents are recorded unevenly, too unevenly for a rate. Two written records exist, both LinearViewer and both since the fleet started:
- The proxy's 401 flood on 8–9 August: about 12 hours degraded, root cause not found.
- The database-backed reads that hung on 22 September (LIN-2993).
Tickets name four more, with no written record:
- LIN-430 (12 June): a merge on red CI.
- LIN-1345: uncapped spend on a shared key.
- LIN-2077 (August): simple-dispatcher sessions left idle.
- LIN-2446 (2 September): simple-dispatcher launches wedged overnight, with fixes merged by the operator under incident.
None of the six predates June.
Two candidate measures are not supportable. Reopened tickets: the proxy exposes no state history, and where fetched comments mention reopening it is prose, not a state change. The house habit is to file a new ticket instead ("Follow-up filed (separate, not reopened work)", LIN-493). The broad fix-follow-up, as the ticket words it, is any fix commit to the same files within 30 days. It ranges from 2% to 85% of PRs by month in LinearViewer and moves with how often the hottest files change. It measures churn, not defects.
Method
Populations.
- Every LinearViewer-team ticket (3,092, which tracks both repos) was paged over the local
proxy on 30 September by
scripts/survey-reliability-tracker.mjs. Full detail (dates, comments) was fetched for all 265 Bug-labelled tickets, for incident-titled tickets, for a systematic sample of every 8th shipped ticket by number (169, of which 164 first merged from June to September) and for the 22 tickets that Bugs name as introducers. - Merged PRs (1,590 LinearViewer, 248 simple-dispatcher) and every push-to-main CI run of the
TestsandCIworkflows (1,672 and 107, paged one month at a time because the API caps a filtered query at 1,000) come from GitHub throughgh, inscripts/survey-reliability-github.mjs. - Commits come from
origin/mainfirst-parent history in both clones. - All snapshots are written under the git-ignored
data/survey/.
Classes. Each Bug was read once against the rubric recorded in
reliability-baseline-defects.json. The rubric was fixed before reading and is built on
ticket-record-and-quality.md's defect, inert, record, context and routed classes. Each
verdict names the repo, whether a human or an agent found the fault, and the introducing
ticket if the text names one. The author re-read a 1-in-13 systematic sample of 20 verdicts
and agreed with 19. Review send-backs in the sample were read against the rubric in
reliability-baseline-review-blockers.json. Ticket size is the added plus deleted lines
across a ticket's PRs. Process depth is the number of distinct gates whose heading appears in
the first three lines of a comment: plan-review, review or verdict, close-out.
Re-running.
node scripts/survey-reliability-github.mjsnode scripts/survey-reliability-tracker.mjsnode scripts/survey-reliability-tracker.mjs data/survey/reliability-depth.json --list-from data/survey/reliability-tracker.json --only-extra --sample data/survey/reliability-github.json- The same command with
--alsoand the introducer list. node scripts/survey-reliability.mjsfor every number here.node scripts/survey-reliability-figures.mjsfor the three figures.
The proxy calls ran at about 6 a minute, under the survey's 15/min share. Fleet start is
4 June 2026, when simple-dispatcher's Stop-hook substrate began (its February commits were a
four-commit stub). The Autopilot design followed on 5 June and its kickoff on 14 June (PR
#462). steady-base.md dates the fleet to June (:95).
Limits
- Unfound and unfiled defects are invisible. Every defect number here is a Bug someone filed. A fault in a path nobody runs, a fault fixed quietly, or one filed without the Bug label is missing. All the rates are floors, and the gap is widest wherever finding was weakest.
- The instrument changed with the process. Before June, PRs rarely named tickets, the operator was the only finder, and Bug labelling was steadier but sparser. From August, the fleet's reviews file residue and label it Bug. The rise in the headline therefore overstates any rise in faults made. How much it overstates cannot be told apart from a real rise.
- Filing month is not the month the fault was made. A Bug filed in September can report a fault from January. Only the 24 attributed escapes carry the merge month, and those are too few to stand as their own series.
- The verdicts are one reading each. Five subagents read one batch each. An independent
second reading of 44 (
survey-check.md) agreed on 39 verdicts (κ ≈ 0.73), on 42 repos and on 41 finders. Residue is detected by its label and, since version 2, by 21 tickets read by hand; agents label it inconsistently, so more may be counted as fresh escapes.introducedBycan name the ticket that found or deferred an older fault rather than the one that wrote it; version 2 removes 18 such rows (12 of them the script already dropped silently, as filed before the named ticket merged). Residue tickets sit on the escaped/routed line. The rubric counts a fault found in older code by another ticket's review as escaped, followingwhat-the-reviews-checked.md. Reading those as routed would move up to 70 Bugs (49 labelled, 21 not) from escaped to routed and cut August–September sharply. - Depth and size are observational and small. The depth denominators come from a 164-ticket sample, and each bucket holds 4 to 8 escapes. Bigger and riskier work gets more gates, so this data cannot show whether a gate prevents escapes.
- The review-catch share rests on 9 tickets. It uses one reading of truncated review comments (6,000 characters), and the send-back detector over-selects. The population was chosen by a subagent, not by committed code, and one catch (LIN-1137) had already failed CI. A bootstrap over the 104 reviewed tickets puts the 35–45% anywhere from 25% to 63%.
- CI and PR data are GitHub's. They are not one of the ticket's four named sources, and are used only for merged PRs and runs on main. simple-dispatcher had no CI before 25 July.
Next
- Do escapes that later reviews find in older code (49 labelled so far, and at least 21 not) come mostly from before the
fleet started, or from the fleet's own first months? The introducing commit for each can be
found with
git blameon the fix. This question goes intoproposals.md. - Is simple-dispatcher's September (24 escapes on 55 PRs) a real change in fault rate, or one cluster found by one campaign? That needs the Bugs grouped by the file each fix touched.
- Would a full second reading of the 265 verdicts, especially the residue ones, change the
headline?
survey-check.mdread 44 and found the residue label missing on at least 21 escapes.