Which of Harbour's tests earn their keep, and what does the rest cost?
The behavioural tests earn their keep, and so do the browser tests that catch interface faults. The pins cost less than they look. Behavioural tests are 93% of Harbour's unit tests and nearly all of simple-dispatcher's. They alone kill most of the sampled logic mutants, and they are most of the tests that failed before a production edit inside agent sessions, though a hand reading finds few of those edits were catches. Harbour's 851 pin-class tests (text pins, census pins and source scans) take about 5% of the unit suite's serial run time. They have turned CI red on a pull request only twice; count pins inside browser specs, classed as e2e, did three more times. Their cost shows up as friction instead. Inside sessions, a census or text pin demanded a bump at least as often as it caught a fault, though each class has only one or two catches. Changed lines in pin files are 2.8% of changed test lines, rising to 4.9% in September; edits to assertion literals alone are 0.3%, and falling. Eighteen tickets since June, twenty by the paper's own rule, exist mainly to repair or bump a pin, and ten of the eighteen came in September; about five of them are bumps. Two costs are larger than the pins. The first is flakiness: browser specs that fail and then pass on the same commit are the largest single cause of red CI. The second is per-file overhead. Most of the unit suite's time is spent outside any test, and a third of Harbour's serial time is four files idling for 25 seconds each after their tests have finished, held open by a timeout timer that is never cleared. In parallel it adds about 20 to 30 seconds to the suite's wall-clock time, on a simulated pool of three to nine workers. simple-dispatcher has almost no pins (seven tests). Its costs are process-spawning tests, one flaky reaper test, and one test that fails on the fleet's own machine every time.
Findings
The estate is overwhelmingly behavioural, and pins are a small, separate slice. Every
it()/test() block at HEAD was classified by what it asserts and what it reads. A blind
hand-coding of 85 of them agreed with the classifier on 22 of 25 pin-class calls and 35 of 36
behavioural ones (Method).
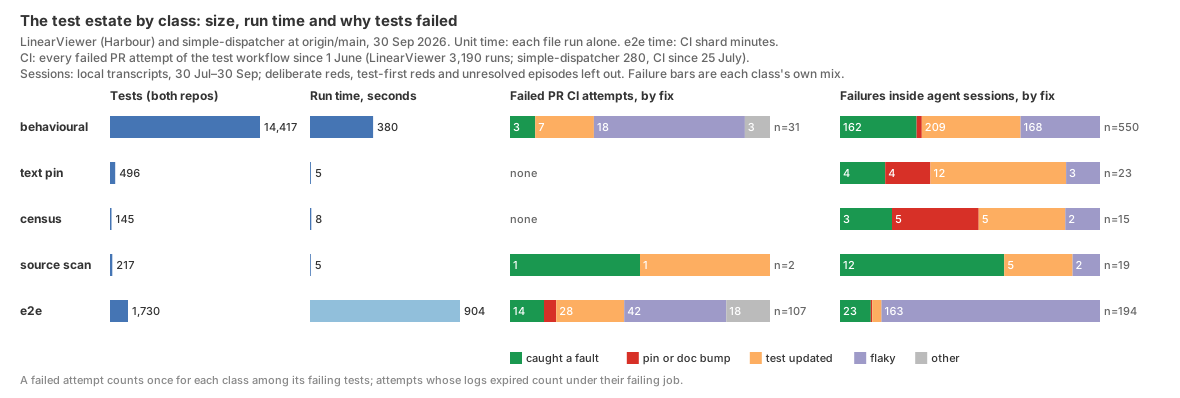
| Class | LinearViewer (Harbour) | lines | serial run time | simple-dispatcher |
|---|---|---|---|---|
| behavioural | 11,600 | 153,241 | 306 s | 2,817 |
| text pin (a prompt or doc contains a string) | 490 | 5,097 | 5 s | 6 |
| census (a total or inventory) | 145 | 2,307 | 8 s | 0 |
| source scan (greps production source) | 216 | 3,390 | 5 s | 1 |
| e2e / full-system | 1,646 | 29,371 | ~15 CI job-minutes | 84 (not in CI) |
The 14,097 Harbour test cases match growth-atlas.md's count, and the 12,451 unit tests
match survey-check.md's. growth-atlas.md counts 6,234
"text pins" by assertion shape: every .includes( or assert.match( call. Most of those
are behavioural checks on rendered HTML, messages and return values. Only about 1,400
assertions in 490 tests pin the wording of a prompt or a doc. That is close to the 493
steady-base.md counted in the prompt test files.
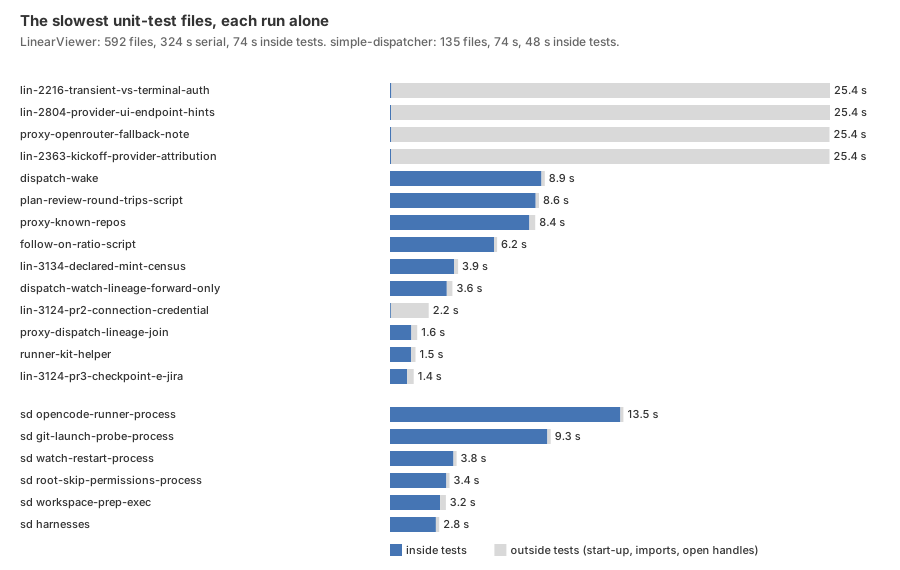
Run time is start-up and one open handle, not assertions. Harbour's unit suite takes 45 s
in parallel. Run one file at a time, it takes 324 s, and only 74 s (23%) of that is spent
inside a test. The median file takes 0.28 s, most of it start-up and imports. Four
behavioural files finish their tests in under 0.1 s, then wait about 25 s each before the
process exits, about 25.4 s a file in all. Those four files are 101 s, or 31% of the serial
total. With --test-force-exit, lin-2363-kickoff-provider-attribution.test.js takes 0.54 s
instead of 25.4 s, so an open handle is holding the process. The handle is a timer, not
armKeepalive (lib/http-keepalive.js:21), whose 25-second default is a coincidence. All four
files import routes/proxy.js, whose withTimeout arms a setTimeout of GRAPHQL_TIMEOUT_MS,
25 seconds, and never clears it (routes/proxy.js:337, :374-384). In the check's scratch
copy, unref'ing that timer brought each file to under half a second with every test passing;
unref'ing armKeepalive's timer changed nothing. All four files were added between 3 August
and 12 September. The wait costs wall-clock time too: over the per-file times, a pool of nine
workers finishes in about 26 s without it against 47 s with it, and a pool of three in 75 s
against 108 s. CI runs the unit suite twice (test.yml:47-48, :59-60). In simple-dispatcher, 65% of the 74 s serial time is inside
tests, and the top five files carry 45% of it: four *-process tests that spawn child
processes, and workspace-prep-exec. The pin classes take 18 s of
Harbour's 324.
In CI, the browser suite fails and the unit suite rarely does. Every failed attempt of each repo's test workflow since 1 June was classified by what made its branch green next:
- LinearViewer: 181 failed attempts in 3,190 runs. 144 were in the E2E shards and 42 in the unit job. The snapshot missed 26 runs of 12 and 15 June; a fresh pull gives 183 in 3,216.
- On pull requests (133 attempts): 54 flaky (the same commit passed on re-run), 34 fixed by changing the test, 19 fixed in product code, 5 pin bumps, 10 never went green.
- Failing tests by class: over both repos' 140 PR attempts, e2e specs carry 107,
behavioural unit tests 31, source scans 2, text pins and census tests none; 38 attempts with
no named test are counted by job. Counting LinearViewer's named tests only: e2e 71,
behavioural 24, source scans 2. Three e2e attempts failed on a count pin inside a browser
spec (
audit.spec's template count, twice, andtemplates.spec's "all 16 non-meta templates"). - What the e2e specs catch: 14 attempts fixed in product code, 12 of them in interface
code, among them navigation CSS,
public/next-run.jsandpublic/observation.js. They are fewer faults than attempts: threeheader-navattempts are one branch failing a test its own PR added, and twonext-runattempts share one commit. They also cause 42 of the flakes, led bysession-page,observation-rulings,dispatch-presetsand the reduced-motion livebar inobservation.spec. - Unit-suite reds in CI: 13 of the 42 are flakes (
tree.test.js6 times,prompt-trace-store.test.js4) and 13 are faults; the rest are test updates, infrastructure and merges from main. - simple-dispatcher: CI started on 25 July, and 8 attempts in 280 runs failed. Seven of
the eight were one test,
completion-unconfirmed-reaper-handoff-runtime.test.js, and it was flaky in practice. - Accuracy of the "fault" label: the mechanical label was right 10 times in 11 on pull requests, but only 2 in 9 on pushes to main. There the next green commit is just the next merge, so push rows are left out of the headline. These two rates were read by hand; no committed script produces them.
Inside agent sessions, where the unit tests actually fail, a catch is the rare outcome, and pins bump at least as often as they catch. Transcripts from 1,219 sessions (31 August to 30 September; one stray run dates from 30 July) contain 11,088 test runs and 6,169 failure episodes. Most reds are intended:
- 3,267 are deliberate: a mutation probe, a stashed fix or a baseline run.
- 1,386 are tests written first, before the code that makes them pass.
Of what remains, 225 episodes ended with a production edit before the next green run, which is the most a test could have caught. It is a ceiling, not a count: in a hand reading of every 16th behavioural episode, 1 of 10 was a real catch, the rest missed probes, tests written first, environment failures and fixtures. By class, per thousand tests:
| Class (both repos) | production fix | pin or doc bump | test rewritten | flaky |
|---|---|---|---|---|
| behavioural (14,417) | 11 | 0.8 | 14 | 12 |
| text pin (496) | 8 | 8 | 24 | 6 |
| census (145) | 21 | 34 | 34 | 14 |
| source scan (217) | 55 | 0 | 23 | 9 |
| e2e (1,730) | 13 | 0.6 | 4 | 94 |
The pin rows rest on very few events: 4, 4 and 12 text-pin episodes, 3, 5 and 5 census
episodes. Read by hand, census tests show one real catch against three bumps, and text pins two
catches (one of them a syntax error) against one bump and three false positives from an
ordering pin. All 12 text-pin rewrites are one mutation probe the detector missed. So a pin
demanded a bump at least as often as it caught a fault, and most of the labels behind the
per-thousand rates are wrong. Source scans have the highest fix rate per test. But a scan
fails when source stops matching a pattern, so the "fix" may be editing source back into the
shape the scan expects: 6 of the 12 are one session re-pointing scans after code moved. cheap-implementer.md found the same
of that repo's witnesses: they proved the tests pinned the code. One simple-dispatcher test,
build-launch-applescript.test.js, failed in 109 sessions and was left red almost every
time. It needs osacompile to resolve iTerm's terms, and it fails on the fleet machine
itself. opencode-runner.test.js fails whenever the fleet's SD_WORKER_USAGE_RELAY=1 is set
(config.js:1177, the test at test/opencode-runner.test.js:2011), and passes without it.
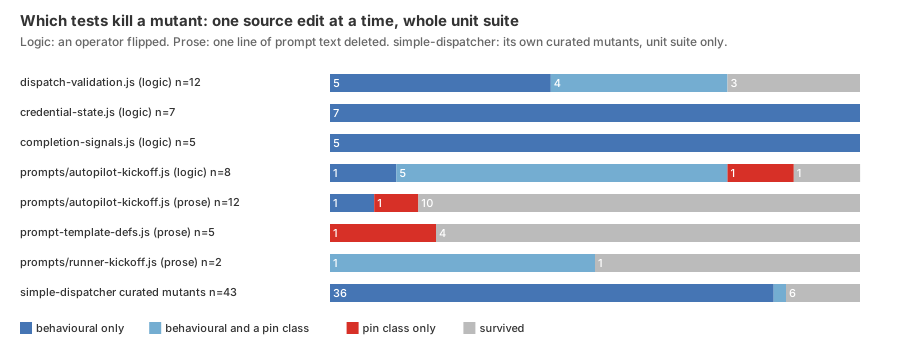
Mutants: behavioural tests kill the logic; text pins catch prompt branches but seldom a deleted line of prompt prose. Mutants were sampled as small source edits, one at a time, each run against the whole unit suite:
- Harbour logic mutants: 32 operator flips across four modules. 28 were killed: 27 by behavioural tests (18 by behavioural tests alone), 10 by a text pin and 1 by a census test. In the prompt builder, text pins killed 6 of 8 branch mutants (a flag that selects which sentence renders), and one of those was caught only by a text pin.
- Surviving logic mutants: three
>→>=flips on the length limits indispatch-validation.js, and one&&→||in the kickoff's goal line. - Harbour prose mutants: 19 deletions of one line of prompt text, across the autopilot kickoff, the runner kickoff and the template definitions. 15 survived the whole suite. Of the 4 killed, text pins caught three, two of them alone. Behavioural tests caught two: one alone, and one line of the runner kickoff together with a text pin.
- simple-dispatcher curated mutants: simple-dispatcher keeps a curated mutation gate of
47 mutants, each paired with a full-system killer. Two of them target Harbour's
lib/dispatch-wake.jsand were not run here. Of the 45 run, two no longer apply, and its unit suite alone kills 37 of the 43 that do. Behavioural tests kill all 37, and a text pin also kills one. Two mutants no longer apply: the code they target has changed shape (reapers.js:689,dispatcher.js:180), so the gate would now report two errors. Neither the gate nor the system suite runs in CI; that runs onlynpm test.
Pin friction is small in volume, and whether it is rising depends on what is counted.
- Commits: since June, 5 of Harbour's 1,771 non-merge commits consist only of literal-only test edits. 181 commits (14% of those touching tests) edit at least one assertion literal.
- Pull requests: in 1,280 Harbour PRs, changed lines in pin files are 2.8% of changed test lines. New tests are 83%. The share rose from 1.0% in June to 4.9% in September, and PRs touching a pin file went from 15 a month to 130. But 88% of those lines are every changed line of a file flagged as a pin file, and a file is flagged for so little as the word "census" or one source read. Edits to assertion literals alone are 0.33% of changed test lines, and they fell from 0.75% in June to 0.27% in September.
- PRs made mostly of pin edits: pin edits are more than half the test change in 32 PRs (11 on a strict rule). Ten PRs change only pins while touching at most ten production lines.
- Tickets: of 2,835 tickets since LIN-304, 18 exist mainly to bump a count or repair a
pin; two more meet the same rule (LIN-2554, LIN-2590). Read one by one, about five are bumps:
two snapshot re-baselines (LIN-1033, LIN-1614), two doc or comment counts with no test
involved (LIN-687, LIN-2481), and LIN-3133, which also changed production code but exists
largely for the DI-parameter census
fleet-complexity-read.mddescribed. The other 13 repair or extend weak pins. LIN-2985 and LIN-2989 add count entries nobody had pinned, and LIN-2988 was cancelled. Ten of the 18 came in September. Another 61 tickets did real work but also had to move a pin. - simple-dispatcher: one PR of 246 is pin-dominated (#241), and one ticket, LIN-2903, which is among the 18.
Candidates, described only.
- Evidence says these rarely or never catch a real fault, while costing friction or time:
- Harbour's census tests: no unit-suite CI failure, though count pins inside browser specs failed three times, and more bumps than catches in sessions, on a handful of events.
- Harbour's text pins on prompt prose: no CI failure, and no fewer bumps than catches. They caught 3 of 19 deleted lines in the prose sample.
- The e2e specs that fail mostly as flakes:
session-page,observation-rulings,dispatch-presets,task-chat,ship-biscuitand the livebar case inobservation. - The unit flakes:
tree.test.js,prompt-trace-store.test.js, and simple-dispatcher's reaper-handoff runtime test. - Two environment-bound simple-dispatcher tests: AppleScript compile and
opencode-runner's usage-relay case. - The four files that idle for 25 s. Their tests are behavioural and may well earn their
keep; the cost is the uncleared timer in
routes/proxy.js.
- Evidence says these clearly earn their keep:
- Behavioural unit tests on logic modules. They fail before most local production edits and
are the only killers of most logic mutants:
credential-state,completion-signals,dispatch-validation, and simple-dispatcher's reapers, claim and feedback paths. - The e2e specs that caught interface faults in CI:
header-nav,next-run,ship,observation-rulingsanddispatch-page. - Text pins on prompt branches. They are the only killer of one kickoff-builder mutant, and a co-killer of five more.
- Source scans on wiring, which have the highest fix rate per test, read with the caution above.
- Behavioural unit tests on logic modules. They fail before most local production edits and
are the only killers of most logic mutants:
Method
Classes.
scripts/survey-tests-shape.mjssplits each test file atit(/test(/t.test(and classifies each body. The first matching class wins:- e2e:
tests/e2e,tests/visual, or simple-dispatcher'stest/system. - census: a file named census, inventory or roster, or a number literal asserted on the size of an exported inventory or a read doc.
- source scan: the body reads production source as text.
- text pin: all but at most one assertion are text matches, and their subject is a prompt, instruction or doc.
- behavioural: anything else with an assertion.
Tests with no
assertcall (101 in Harbour, 9 in simple-dispatcher) are folded into behavioural, because the hand-coding found 11 of 12 of them behavioural.- e2e:
Validation.
--sample 70 --seed 3151drew a stratified sample of 85 tests, weighted three to one towards behavioural. It was shuffled and hand-coded blind by a separate subagent (test-estate-validation.json);--validateprints the confusion. Raw agreement was 64 of 85. By class:- behavioural 35 of 36;
- e2e 12 of 12;
- source scan 6 of 7;
- text pin 8 of 12, with 2 of the misses really census;
- census 2 of 6, with 3 really source scans.
The pin family as a whole is right 22 times in 25, but the lines between its three members are rough.
Timing.
survey-tests-timing.mjsruns each unit-test file alone undernode --testwith a JSON-lines reporter (survey-tests-reporter.mjs), on the operator's machine at origin/main. A file's time outside its named tests is spread over its tests by line count. e2e minutes are the latest week's four E2E shard jobs, fromsurvey-growth-ci.mjs(container start-up included).CI.
survey-tests-ci-runs.mjssnapshots every run oftest.ymlandci.ymlsince 1 June, paged by half-month.-ci-fetch.mjspulls jobs and failed-test lines for every failed attempt, plus the first attempt of every green re-run.-ci-classify.mjsfinds the next green run on the branch and diffs the branch's own commits between the two, then classifies the change:- flaky: the same sha passed later;
- fault: product code changed;
- pin bump: only literal-only edits to the failing test;
- doc/prompt: only doc or prompt text changed;
- test updated: any other test change;
- unresolved: the branch never went green.
Logs had expired for 57 of the 181 Harbour attempts; those count under their failing job. Rows are attempts, so one run re-tried many times counts many times: one run gives five flaky rows. Counted by run, e2e flakes are still the largest single cause (47 of 176 failing runs, against 28 e2e faults and 28 e2e test updates), though faults and test updates together outnumber them.
Sessions.
survey-tests-local.mjsreads every dispatched-session transcript still on the machine. It finds test runs and their failing tests, then classifies each (session, test) episode by what the session edited before the same test next passed. Deliberate reds and test-first reds are detected by command and text cues.Mutants.
survey-tests-mutate.mjsapplies one edit at a time in a throwaway worktree and records every test that fails beyond the unmutated baseline. It draws two kinds of edit:- operator flips, evenly spaced over
dispatch-validation,credential-state,completion-signalsand the autopilot kickoff; - one deleted line of template prose, with
--prose-onlydrawing only these.
For simple-dispatcher it runs the curated
MUTANTSfromrun-mutations.jsagainst the unit suite only.- operator flips, evenly spaced over
Friction.
survey-tests-friction-git.mjspairs removed and added lines per diff hunk and calls a pair a literal edit when the two lines match after normalising strings, numbers and regexes.-friction-proxy.mjspulled the ticket list at 7.5 s a call, 39 calls in all.-friction-tickets.mjsholds the hand classification of 119 candidate tickets.Join.
survey-tests-analyse.mjsjoins everything by (repo, file, test name) and prints every number above.survey-tests-figures.mjsdraws the three figures. Snapshots live in the git-ignoreddata/survey-tests/.
Limits
- The classifier is a heuristic. Census and source scans blur into each other, and about 3% of "behavioural" may be unrecognised pins. So the pin counts are a floor, but the pin family's total is sound.
- Timing comes from one machine at one moment, and not an idle one: sibling sessions were running. Absolute seconds are high, but the shares, and the four 25-second files, reproduce.
- CI sees only what was pushed. Agents run the unit suite before pushing, so CI under-states unit-test catches and over-states the e2e share. The session data exists to correct that.
- The "fault" label is generous. In sessions, any production edit before the next green counts. On main, the next merge counts. Both over-state catches, and the session figures most for source scans.
- The session labels are unreliable for the pins. Any structural edit makes a failure a "test rewrite", and a missed probe becomes a "rewrite" or a "fix", so on a hand reading most pin labels are wrong in both directions. The pins' bump-to-catch comparison rests on one or two real catches a class.
- Deliberate-red detection is keyword-based. A probe it misses becomes a false "fix" or "unknown".
- Sessions are retained for about 30 days, so the session data covers 31 August to 30 September only, when pins were most numerous.
- Squash merges hide branch commits for about 60% of Harbour PRs. The per-commit pin count is therefore a floor; the per-PR diffs are not affected.
- The mutant sample is small (32 logic and 19 prose in Harbour, 43 curated in simple-dispatcher) and drawn from modules chosen for testability. It says which classes can kill a mutant, not the estate's mutation score.
- "Rarely catches" is not "never matters." A census test that has never failed may still be the only thing guarding an invariant nobody has broken yet. This paper cannot see that value.
Next
- Which of the 851 Harbour pin-class tests have never failed for any reason? Joining each test's age to every failure record here would separate pins that bump often from pins that sit silent. That is the population a loosening would actually touch.
- When did the four 25-second files start holding the suite open? They arrived between 3
August and 12 September, and the uncleared timer in
routes/proxy.jsholds them. One run per month-end ofsurvey-tests-timing.mjswould say how much of the eight- to tenfold slowdown thatgrowth-atlas.mdandsurvey-check.mdmeasured they explain. - Are the flaky e2e specs flaky in the product or in the harness? Six specs carry most of the flakes. Reading their retry traces would say whether a real race is hiding among them.
- Does a deliberate red find anything? Half of all in-session failures are probes the house rule asks for. Sampling them for a probe that surprised its author would show whether the rule buys catches or only certainty.