The Price of Tomorrow
AI investment, technological progress, and the long journey from capability to economic value
Prepared for John Kershaw | October 2026
Financial markets have priced artificial intelligence as though new capability becomes profit for the people who build it, and becomes it soon. The record to October 2026 does not yet support that, but it does not support a crash either. The capability of the models compounds and its price falls fast. Whether the cost of getting a piece of useful, checked work out of them falls as fast is unknown, because nobody measures it. Use spreads wide and stays shallow. National productivity sits on its long-run trend. Where value can be measured, most of it goes to the people using AI, and among the suppliers it is the sellers of scarce chips who are visibly earning. Set side by side, the best-measured gap is widening: two of the largest buyers' spending is outrunning the cash that pays for it. The answer to the bubble question is therefore likely to differ by layer of the industry rather than be one verdict: some markets, chiefly the financing of compute, over-invested against what their owners can capture; some applications worth little; some narrow uses, where the output can be checked, already showing large gains. Whether the financial and diffusion timelines can be separated is not yet decided. The essay says what each answer predicts and what would settle it.
The question John put was whether this is a technological revolution whose financial expectations have arrived too early, or an investment boom whose promised economic revolution will never fully arrive. The answer here is that both can be true at once, in different layers of the same economy, and that the next four years can tell them apart if the right things are measured. That last part is the essay's most practical contribution, and it closes the body.
A note on reading. Every claim taken from a source carries a bracketed key, such as [CEN26], into the annotated reading list, which says what each source supports, what it does not, and which of four labels it carries. Observed means a published measurement, an experiment or established history. Inferred means a reading that explains several observations but is not causally established. Hypothesised means a proposed mechanism, usually where data is missing. Predicted means a development that would support or contradict a hypothesis. In the body, a keyed fact is Observed unless it says otherwise; the other three labels are written where they apply. This is the sequel to Learning While the Tools Change [H-LWT], which argued that experience, skill with AI and the tools themselves run on separate clocks. This essay moves the same question from a team of developers to the economy.
1 The boom
What was built
Start with what can be counted. The Stanford AI Index puts global corporate investment in AI at $14.6 billion in 2013 and $581.7 billion in 2025, with private investment alone at $344.7 billion, up 127.5% in a year [AII26]. That is thirteen annual points from one source, and the cleanest long series in this essay; its earlier editions revise their own back-series, so it should be read from one edition, not spliced.
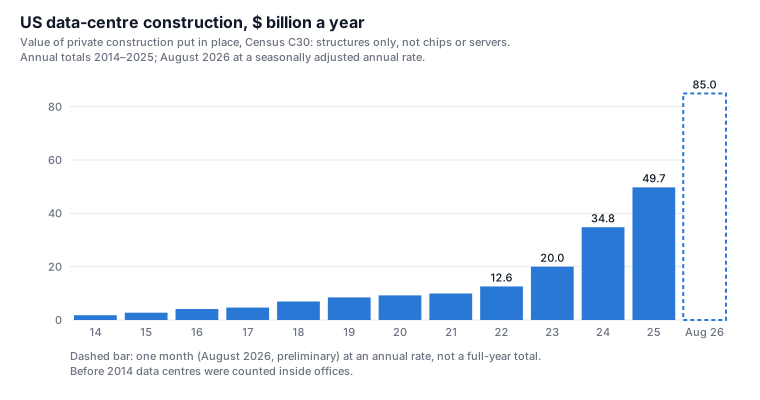
The physical build is clearer still. The Census Bureau has counted data-centre construction separately from offices since 2014. In 2014 the United States put $1.8 billion of data-centre structures in place; in 2025, $49.7 billion; and in August 2026 the monthly figure ran at an annual rate of $85.0 billion, 73% above August 2025 [CEN26]. Those are buildings, not chips: the servers and accelerators inside them are counted elsewhere.
The chips show up in company accounts. Nvidia's data-centre segment earned $89.0 billion in the quarter to July 2026, up 117% on a year earlier, at a 75% gross margin [NVDA26]. Alphabet spent $51.4 billion on property and equipment in the third quarter of 2026 alone [GOOG26]. Microsoft spent $41 billion in its quarter to June and said "customer demand continues to exceed available capacity" [MSFT26]. Meta spent $34.9 billion in the September quarter and guided to $135–145 billion for 2026 [META26].
At the scale of the whole economy, the St. Louis Fed estimates that AI-related categories (information-processing equipment, software, research and development, and data centres) contributed 0.97 percentage points to US real growth in the first three quarters of 2025, 39% of all growth, against 0.81 points and 28% in 2000 [STL26]. That is a gross figure. Much of the equipment is imported, and the BEA's first estimate of the third quarter of 2026 names capital goods as the largest contributor to imports in the same release in which it names information-processing equipment as the leader of equipment investment [BEA26]. So the boom's contribution to American output is smaller than its contribution to American spending.
Where the bubble argument is strongest
The bubble case is not that the numbers are large. It is in how the spending is paid for and what is being paid for it.
Until 2026 the standard reply to "bubble" was that the largest spenders paid from their own cash flow, unlike the debt-funded telecom carriers of 1999. That reply weakened this year. Alphabet's free cash flow was negative $5.9 billion in the second quarter of 2026 and negative $9.1 billion in the third [GOOG26]. Meta's was negative $2.1 billion in the third quarter, when capital spending of $34.9 billion exceeded operating cash flow of $32.8 billion [META26]. A week later Meta raised $37.5 billion of new equity: $25 billion through a forward sale of common stock at $625 a share and $12.5 billion of mandatory convertible preferred [META26b]. The BIS says the five largest hyperscalers' AI spending across 2025 and 2026, over a trillion dollars, is "outpacing earnings and the free cash flow of these firms" [BIS26].
The financing has moved into credit markets. The Bank of England's Financial Policy Committee, citing Morgan Stanley, recorded about $450 billion of AI-related debt issued in 2026 by early September, more than double the whole of 2025, and estimates that $700 billion of data-centre spending over 2026–28 would be financed by private credit; JPMorgan's estimate is $4.1 trillion of debt-financed AI capital spending over 2026–30 [BOE26]. Goldman Sachs, which on balance argued against a bubble, still noted a year earlier that "entities are being funded with 80% debt and 20% equity" [GS25]. Debt changes what a disappointment does. An equity loss is absorbed by the people who chose the risk; a debt loss is passed along to whoever lent.
The revenue at the frontier is real and rising, but it is run-rate revenue set against long-dated commitments. OpenAI's chief financial officer reported annualised revenue above $20 billion in 2025, from $6 billion in 2024, as its compute rose from 0.6 to 1.9 gigawatts [OAI26a]. A company presentation seen by the Financial Times projects revenue of $36 billion in 2026 rising to $350 billion in 2030, against about $856 billion of spending on computing power and $278 billion of cumulative negative cash flow from 2026 to 2030 [OAI26b]. Anthropic reported run-rate revenue above $47 billion in May 2026, when it raised $65 billion at a $965 billion valuation [ANT26]. These are private figures reported by the companies or the press, not audited accounts, and a run-rate is not a year's booked revenue. The bet they describe is that revenue grows about tenfold in four years and that the people who paid for the compute are the ones who collect it.
Sequoia's David Cahn put the gap in one number in 2024: take Nvidia's revenue, double it for the full cost of a data centre, double again for the margin the end user needs, and the industry needed $600 billion a year of revenue it did not have. He expected the shortfall to "cause harm primarily to investors" while founders benefited from cheaper compute [SEQ24]. That is the bubble argument at its strongest. It is not that the technology fails. It is that the people financing it may not be the people paid by it.
The case that it is not as overvalued as it looks
The opposite case is also strong, and it rests on the public companies rather than the private ones. In October 2025 the median forward price-to-earnings ratio of the seven largest US technology stocks was 25, about half that of the seven largest companies at the peak of the dot-com bubble; US AI investment over the previous twelve months was below 1% of GDP, against roughly 1.5–2% at the peaks of 1920s electrification and the late-1990s IT boom and 2–5% for historic infrastructure booms [GS25]. Goldman Sachs is a seller of securities and its report should be read as an argued position, but the arithmetic is checkable.
Revenue at the supply edge is growing faster than in most bubbles. Nvidia's data-centre revenue more than doubled in a year [NVDA26]. Google Cloud's revenue rose 103% to $30.7 billion in a quarter and earned an operating profit [GOOG26]. Microsoft reports demand above capacity [MSFT26]. A boom in which buyers are queueing is not the same as one in which capacity sits idle.
History supplies a caution against the word "bubble" itself. The Richmond Fed's account of the telecom boom found real investment in communications equipment rising from about $62 billion a year in early 1996 to over $135 billion by the end of 2000, then falling to 4.8% of private investment by 2002 from nearly 7% in 2000. Its authors explicitly declined to call it a bubble that burst: prices and investment had been based on beliefs about future demand that turned out wrong in a period of rapid technical and regulatory change [CHW03]. A forecasting error on that scale can destroy as much capital as a bubble. It is still a different mechanism, and it predicts something different afterwards: the cable stayed in the ground.
The BIS, which is not given to optimism, makes the same distinction in reverse. Its 2026 report groups the canal mania, the railway mania, 1920s electrification and the dot-com boom as episodes that "all shared one common trait: a genuine technological breakthrough that attracted capital in excess of what commercial returns could ultimately justify" [BIS26]. The breakthrough was real each time. The returns were not where the capital went looking for them.
Value created is not value captured
That phrase, returns not where the capital looked, is the centre of the economic argument, and it runs through every later section. William Nordhaus estimated that only "a minuscule fraction" of the social returns from technological advances in the United States between 1948 and 2001 was captured by the firms that produced them; most of the benefit went to consumers [NOR04]. That is a finding from another era about the whole economy, not about AI, and it should be read as a base rate for the mechanism, not as an estimate.
For AI there is one direct attempt to measure the user side. Brynjolfsson and colleagues asked representative samples of US adults how much they would need to be paid to give up chatbots for a month. The aggregate came to $116 billion in 2025 and $172 billion in 2026, which the authors say "substantially exceeds" estimated US generative-AI revenue [BCE26]. It measures one market, US consumers' chatbot use, so it should not be read against the enterprise and programming-interface revenue that makes up much of the providers' sales. It is also stated preference, not observed spending; the mean is $124.50 a month while the median is $11.40, so a few heavy users carry most of it. But it points the same way as Nordhaus. Inferred: so far, the value of generative AI to its users is larger than what its sellers collect, and the gap is the normal shape for a general-purpose technology, not a sign that the value is imaginary.
Capture also splits inside the supply side. Nvidia earns a 75% gross margin on the chips [NVDA26]; the model providers project years of negative cash flow [OAI26b]; the data-centre owners are financing with debt [BOE26]. Inferred: whoever holds the scarce input collects, and whoever competes to sell a commodity on top of it may not. A technology can therefore be transformative while most of its investors earn disappointing returns, and the two statements are not in tension.
2 The missing productivity
The experimental evidence for task-level gains is solid and narrow. In a staggered rollout to 5,179 customer-support agents at one firm, an AI assistant raised issues resolved per hour by 14% on average and by 34% for novice and low-skilled workers [BLR23]. Similar results exist for writing, consulting and coding tasks. They measure a task done faster, inside one organisation, over months.
The evidence against easy generalisation is as solid. METR's 2025 randomised trial found experienced open-source developers took 19% longer with AI on their own repositories, having expected to be faster [METR25]. Its 2026 follow-up, with 57 developers and over 800 tasks, estimated that returning developers took 18% less time with AI (the interval runs from 38% less to 9% more) and new ones 4% less (from 15% less to 9% more), and METR itself calls the result "only very weak evidence" because developers increasingly refuse to work without AI and select their tasks accordingly [METR26]. A clean measurement became impossible to run at about the moment it became interesting.
Above the firm, the numbers shrink. Linking adoption surveys to Danish administrative records, Humlum and Vestergaard estimate precise null effects on earnings and hours, ruling out effects larger than 2% two years after ChatGPT's launch, even as employers reorganised tasks around it [HV26]. Acemoglu's task-based model puts the ten-year gain in total factor productivity at no more than 0.66%, and below 0.53% once hard-to-learn tasks are allowed for [ACE24]. US workers told Bick, Blandin and Deming that generative AI assisted between 1% and 5% of all work hours and saved the equivalent of 1.4% of them [BBD24]. And US nonfarm labour productivity has grown at 2.1% a year since the end of 2019, exactly its rate since 1947 [BLS26].
The standard reading of that gap is the productivity J-curve. A general-purpose technology needs complementary investment, mostly intangible, in reorganised processes, skills, data and software. Spending on intangibles is poorly measured, so in the early years output looks too low for the inputs, and later, when the intangibles pay off, it looks too high. Brynjolfsson, Rock and Syverson estimate that adjusting for intangibles linked to computer hardware and software puts US productivity in 2017 15.9% above the official level [BRS21]. Paul David made the older version of the argument: the electric dynamo raised factory productivity only after factories were rebuilt around it, decades after it was available [DAV90]. The IT boom of the 1990s showed the pattern resolving: information technology accounted for about two-thirds of the one-point rise in productivity growth between the first and second halves of that decade [OS00]. Comin and Hobijn put the average lag between a technology's invention and a country's adoption at 45 years, across fifteen technologies and two centuries [CH10].
All of that is consistent with AI's gains being delayed. None of it shows they are. A J-curve is a mechanism for why a real gain could hide, not evidence that a hidden gain exists, and a flat productivity line is what both a delayed large effect and a prompt small one look like in 2026. Hypothesised: the difference will show first not in the national figure but in the spread between industries. If AI's gains are real and delayed, industries most exposed to it should begin to pull away from their own pre-2023 trends before the aggregate moves; if the gains are small, no such divergence should appear. Eloundou and colleagues supply the exposure measure: about 80% of US workers have at least a tenth of their tasks exposed to language models, and 19% at least half, but they make no prediction of timing [ELO23].
Two warnings about reading these series together. First, investment does not have to lead productivity. A strong economy funds capital spending, so causality can run from growth to investment as easily as the other way. Second, the series that rose together from 2023 to 2026 share common causes: interest rates, the demand cycle after the pandemic, and a decade of cloud building that was under way before ChatGPT. Lines that move together in that period establish nothing about which drives which.
3 The adoption problem
Wide and shallow
"How many use AI" has several honest answers. In late 2024 nearly 40% of US adults aged 18 to 64 used generative AI, 23% of workers had used it for work in the previous week, and 9% every working day [BBD24]. A year later the same economists' Real-Time Population Survey put work use at about 41% and daily use at about 12% [FED26]. Firms answer differently depending on who is asked: an employment-weighted 78% of firms in the Atlanta Fed's executive survey report using AI, while the Census Bureau's Business Trends and Outlook Survey found about 18% at the end of 2025 and 19.8% in May 2026, rising to 37% among firms with at least 250 employees [FED26] [BTOS26]. The Census changed its question in November 2025, from AI used "in producing goods or services" to AI used "in any business function", so its series is two pieces that do not join [BTOS26].
The gap between "uses AI at all" and "uses it every day for work" is the gap that matters for productivity, and it is large. So is the gap between work and everything else: on ChatGPT's consumer plans, messages that are not about work rose from 53% to more than 70% of use between late 2022 and mid-2025 [CHA25]. Depth also differs by channel. On Claude, conversations in which people hand the whole task to the model rose from 27% to 39% of the total in nine months, and 77% of conversations through the programming interface showed automation patterns [AEI25]. That last figure is one vendor's traffic, but it hints at where depth lives: in software that calls a model, not in people chatting with one.
Three pathways
AI reaches work by at least three routes, and they have different economics.
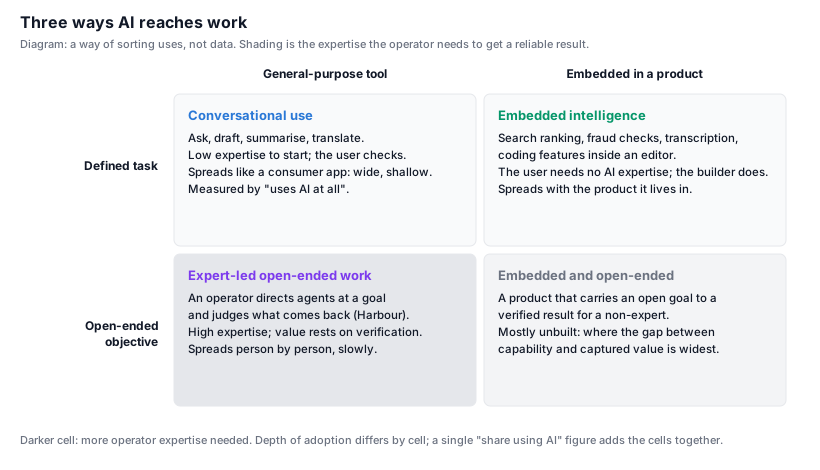
The first is conversational use: a person asks a general-purpose model to draft, summarise, translate or explain. It needs little expertise to start, the user checks the answer, and it spreads like a consumer application, fast and shallow. Most adoption surveys measure this route. Inferred: that may be why their headline numbers are high and their productivity numbers are low.
The second is embedded intelligence: a model inside a product that someone else built, such as fraud checks, transcription, search ranking, or code completion inside an editor. The user benefits without any AI expertise; the expertise sits with the builder. It spreads with the product it lives in, which means at the pace of software sales and replacement, and its value is easy to miss because nobody reports "using AI" when their spam filter improves.
The third is expert-led open-ended work: an operator points capable agents at a goal rather than a task and judges what comes back. It needs the most expertise, and its value depends almost entirely on the operator's ability to verify. It spreads person by person.
The grid has a fourth cell, an embedded product that takes an open goal to a verified result for someone who is not an expert. It is mostly unbuilt. Hypothesised: that cell is where the distance between demonstrated capability and captured value is widest, and where the industry's revenue projections implicitly place most of their growth. If it fills, the optimistic trajectories below become likely; if it stays empty, they do not.
A worked example of the third pathway
Harbour, where this essay is written, is an example of the third pathway, and it is offered as a case study, not as evidence about the economy. Harbour is a control plane that one experienced engineer, John Kershaw, uses to send AI coding agents to work on tickets in an issue tracker, review their output with other agents, and count a change as done only when it has merged and passed review. Its archive holds papers measuring its own record. It has an expert operator, specialised workflows and particular cost limits, so it says something about what the third pathway can do and very little about how common it will become.
Two questions from the wider argument can be put to its record honestly, using only papers it has already published.
Does advanced AI raise the amount of valuable work, or only the amount of work? Over sixty days to 12 September 2026, Harbour's tracker gained 1,484 tickets and closed 701: 2.1 created for every one closed, most of them generated by the agents' own reviews and close-out passes, and 52% of generated tickets were never worked [H-TGT]. A companion paper collapsed related tickets into units and found that units which reached done caused 1.52 further units each, while the rest caused 0.18; three in four units caused nothing [H-RTR]. A hand reading of forty never-worked tickets found 34 still true and 38 clearly stated, and 23 of them were the parent ticket's own unfinished scope filed as a neighbour [H-NWP]. Inferred: the agents raise the amount of work attempted a great deal; much of it is real; a minority is finished; and finished work generates more work than it closes. Whether the valuable output per unit of attempt has risen is not something these papers measured. It goes to Next as a proposal, not to this essay as a finding.
Is the cost of capability the cost of useful work? Three measures are easy to run together and must be kept apart. The first is the price of a fixed level of capability. Epoch AI found the price of reaching a given benchmark score falling between 9 and 900 times a year depending on the task, 40 times a year for GPT-4's level on a set of graduate science questions, over about three years, with the fastest falls the most recent and the least certain to last [EPO25]. The second is the length of task a model can complete. METR found the task length at which models succeed half the time doubling roughly every seven months over six years, and in its 2026 update every 89 to 197 days depending on the window; the best model in that update succeeded half the time on tasks of about 320 minutes, with a confidence interval from 170 to 729 [METR-H]. That is software work, at a 50% success rate, with few long tasks timed against real humans. The third is the cost of a successfully verified outcome: what it costs to get one piece of work done, checked and accepted. No public series measures it. Kapoor and colleagues argue that agents should be judged on cost and accuracy together [KAP24], and leaderboards report snapshots, but nobody tracks the cost of a verified result over time.
Harbour cannot fill that gap either, and that is the point. Its own cost per verified task reads empty, because its price table lacks rows for the models now doing the work [H-PROP]. What its papers do show is why the third measure need not follow the first two. A trial of cheap models found they could implement small tickets, "and the review is the cost" [H-CI]; a literature paper found verification named, by every source that measures it, as the gate on handing agents more autonomy [H-VER]. In October 2026 its paper on capacity found that cheaper models now cleared the bar it had measured, so re-tiering could in principle carry two to three times the work for the same money, and recorded that this had not been tried on a real ticket [H-CC]. So nothing has been observed about the trend in the cost of verified work, for Harbour or for the economy. Hypothesised: it falls more slowly than the price of capability, because review, coordination and the work a system generates for itself do not get cheaper when tokens do. That is a reason to measure it, not a finding, and section 6 proposes how.
4 Setting the series side by side
The brief behind this essay asked for five series to be read together: investment and provider revenue, the price of capability, the length and reliability of the tasks models can do, the depth of adoption, and measured productivity and returns. It asked whether the gaps between them are widening or narrowing. The series are very unequal. Productivity runs back to 1947, the price of capability about three years, and the cost of a verified outcome not at all.
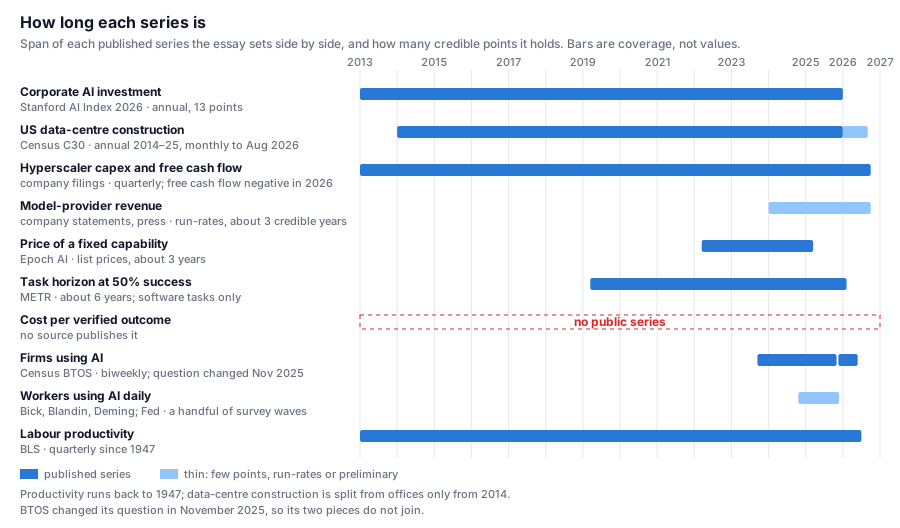
The table takes each pair the argument depends on, and gives a direction only where both sides have at least two credible points on a basis that can be compared.
| Pair | Points behind it | Direction |
|---|---|---|
| Hyperscaler capital spending against operating cash flow | Alphabet, five quarters to Q3 2026; Meta, Q3 2025 and Q3 2026 [GOOG26] [META26] | Widening |
| AI investment against model-provider revenue | investment annual since 2013 [AII26]; revenue one company's run-rate, 2024 and 2025 [OAI26a] | Too short to tell: narrowing as a ratio, widening in dollars |
| Value to users against what sellers collect | surplus 2025 and 2026 [BCE26]; no revenue series on the same basis | Too short to tell |
| Price of capability against cost of a verified outcome | about three years [EPO25]; no series | Cannot be told |
| Task length models complete against daily use at work | six years [METR-H]; two survey points a year apart [FED26] | Widening, Inferred |
| Any use at work against daily use | the same two survey points [FED26] | Holding, in proportion |
| Investment and use against productivity | quarterly since 1947 [BLS26] | Widening, but it tells nothing apart |
Spending against cash. Alphabet's free cash flow, its operating cash less its capital spending, was $24.5 billion in the third quarter of 2025 and $24.6 billion in the fourth, then $10.1 billion, −$5.9 billion and −$9.1 billion in the first three quarters of 2026. Over the year its capital spending more than doubled, from $24.0 billion to $51.4 billion, while operating cash flow fell from $48.4 billion to $42.3 billion [GOOG26]. Between the same two quarters Meta's capital spending, including finance leases, rose from $19.4 billion to $34.9 billion and its operating cash flow from $30.0 billion to $32.8 billion [META26]. This is the best-measured gap in the essay, and it has opened in each quarter of 2026. It does not say whether the spending will pay. It says two of the largest buyers now spend more than their businesses generate, which is why the financing moved into credit markets.
Investment against revenue. In the one year with both on record, OpenAI's annualised revenue rose about 3.3 times, from $6 billion to over $20 billion [OAI26a], while private AI investment rose 2.3 times [AII26]. As a ratio the gap narrowed. In dollars it widened, by about $180 billion. The two readings disagree, and they serve different arguments: the bubble case is about dollars (Cahn's $600 billion), the growth case about ratios. One company's run-rate against the world's investment, over one year, cannot settle which reading holds.
Value against capture. The consumer surplus rose by about half between 2025 and 2026 [BCE26]. OpenAI's revenue tripled in the year before [OAI26a]. The two share no year on a common basis and measure different markets. If revenue keeps growing faster than the surplus, the ratio narrows, which would count against the divided reading in section 5. Two points cannot say, and this is the gap that reading depends on most.
Price of capability against cost of verified work. The first falls between 9 and 900 times a year. The second has no series. The gap this essay cares about most cannot yet be measured.
Capability against depth. In METR's 2026 update the task length doubled every three to seven months, depending on the window [METR-H], while the share of workers using generative AI every day rose from about 9% to 12% in the year to November 2025 [FED26]. The units differ, so "widening" means only that capability grows by multiples while deep use grows by points. Inferred: the distance between what the models can do and what most workers ask of them each day is growing.
Breadth against depth. In the same year, work use rose 9.7 points to 40.7% and daily use 2.9 points to 12%. Each grew by about a third, so daily users stayed at about three in ten of those who use it at all [FED26]. In points the gap opened; in proportion it held. Use is spreading without getting proportionally deeper, or shallower. The Census's firm series cannot add a direction yet: on its new basis it has six months of points, flat at 17–20% [BTOS26].
Everything against productivity. Every series above rose while productivity held at 2.1% [BLS26]. That gap is widening, and it is the least informative of all. A delayed large effect and a prompt small one both predict it, and section 2's two warnings apply.
The result is lopsided. The one gap measured well enough to give a direction, spending against cash, is widening, and it sits in the financing layer. The gaps that would decide who captures the value are too short to tell, or not measured at all: surplus against revenue, and the price of capability against the cost of verified work. That is the main reason to read the next section as hypotheses and section 6 as the essay's result.
5 When the financial and technological cycles collide
A financial correction would not leave the technology where it is. Its effects run in different directions and arrive at different times. Each is a Hypothesised mechanism unless it cites a source.
- Surplus compute could make AI cheaper. If financing stops before the buildings are full, the capacity remains and its price falls. The telecom bust left fibre in the ground that later carried the internet's growth [CHW03]. On this channel a crash lowers the cost of capability; how quickly is not measured.
- Funding could dry up for frontier work and start-ups. Training runs and young companies depend on new capital, not on existing capacity. This channel slows capability, with a lag of a model generation.
- Providers could raise prices. Today's prices sit beneath projected losses [OAI26b]. A provider that must turn cash-positive will charge more, and a workflow that is economic at a subsidised price may not be at a sustainable one. This is the channel that reaches the cost of verified work most directly, and it pulls against the first.
- Consolidation would reduce competition. Fewer providers capture more of the value, which helps the survivors' returns and hurts users' surplus.
- More efficient small models could spread capability anyway. Prices for a fixed capability have fallen fastest at the bottom of the range [EPO25]; a cheap model that clears the bar for a defined task does not need a solvent frontier lab.
- A provider in distress could strand what is built on it. Products, integrations and practices built around one model's behaviour do not move freely; the third pathway is most exposed, because its workflows are tuned to particular tools.
These effects make a single verdict unlikely, and they shape the four trajectories John asked to be weighed. They are competing hypotheses, not predictions.
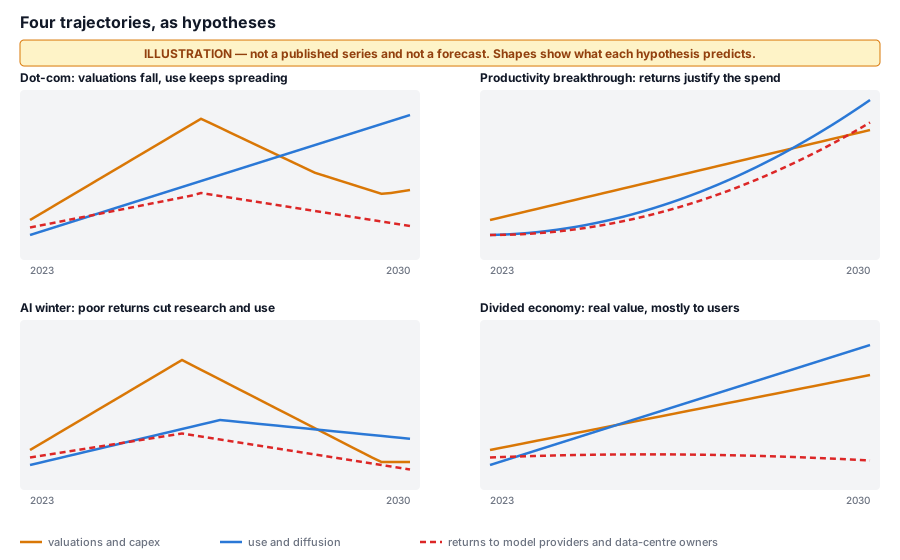
Dot-com. Valuations and capital spending collapse; use keeps spreading on the cheap capacity left behind. It fits a world where the first effect above dominates. It is the telecom story [CHW03] and the most common pattern in the BIS's list [BIS26].
Productivity breakthrough. Returns arrive fast enough to justify much of the spending: revenue at the frontier grows roughly as projected, the embedded open-ended cell fills, and exposed industries pull away from their trends.
AI winter. Poor returns cut research, infrastructure and adoption together.
Divided economy. The technology delivers real value, mostly to its users, while suppliers struggle to earn a return: the shape of Nordhaus's base rate [NOR04].
Stated for the industry as a whole, these trajectories cannot be told apart in 2026. Before 2027 the dot-com and breakthrough paths look much like the present. Section 1 also showed the layers of the industry already behaving differently. So each trajectory is better defined by what it predicts for each layer: chips, cloud, model labs, the owners of data centres financed by debt, and users.
| Layer | Dot-com | Breakthrough | Winter | Divided | The record by October 2026 |
|---|---|---|---|---|---|
| Chips | earn until orders stop, then fall | keep earning | fall | keep earning while scarce | 75% gross margin; data-centre revenue up 117% [NVDA26] |
| Cloud | idle capacity, falling prices | profitable growth | contracts | grows, thin return on the capital | Google Cloud up 103% at an operating profit [GOOG26]; demand above capacity [MSFT26] |
| Model labs | many fail; survivors buy compute cheaply | margins widen | funding gone | revenue grows, margins stay thin | fast growth on run-rates; losses projected to 2030 [OAI26a] [OAI26b] [ANT26] |
| Debt-financed data-centre owners | losses pass to lenders | refinanced from earnings | losses pass to lenders | thin returns, slow repayment | debt rising fast [BOE26]; no returns published |
| Users | use keeps spreading on cheap capacity | use deepens; exposed industries pull away | use falls | surplus well above what they pay | surplus above revenue at one point [BCE26]; use wide and shallow, rising [FED26] |
Read against that table, current data place some layers and not others.
- Chips and cloud are placed, and they contradict the divided economy as the brief stated it. These suppliers are earning, not struggling. But a high chip margin today does not tell dot-com from breakthrough: under dot-com the chip layer also earns until orders stop. And a cloud segment's operating profit does not yet show whether the capital behind it earns its cost.
- Model labs and data-centre owners cannot be placed. The labs' figures are run-rates and private projections, and the owners' returns are not published. These are the two layers where dot-com, breakthrough and divided part company.
- Users are partly placed. At one point in time, in one market, they get more than they pay. Whether that gap is growing is too short to tell (section 4).
- The record argues against winter, so far. Every adoption series rose through 2025 and the first half of 2026 [FED26] [BTOS26]. The Bank of England recorded the sharp July 2026 fall in AI and semiconductor stocks as orderly, with no spillover to core markets [BOE26]. But a winter would begin with exactly that kind of tremor.
So the record does not sit closest to any one trajectory. It argues against winter so far, places the chip layer and users, and leaves the deciding layers open. The divided economy survives only if it is restricted to model labs and data-centre owners. That restriction is drawn after seeing the chip and cloud figures, so it carries no evidential weight until those two layers' own returns are observed. Hypothesised: if a correction comes, it starts in the financing layer and looks like the dot-com case there, because that is where the debt is and where the capacity would outlast it. That is a reading, not a forecast, and the indicators in section 6 can overturn it.
Are the financial and diffusion timelines separable?
The brief assumed two clocks: a fast financial one and a slow diffusion one. It asked whether they are really separate. The evidence does not yet say. It shows a coupling at one end, and at the other end it is silent.
At the supply edge the clocks are visibly coupled. Microsoft says demand exceeds capacity [MSFT26], and OpenAI's revenue grew in step with the gigawatts it could run [OAI26a]: how much AI is sold depends on how much compute is financed. Hypothesised: prices are coupled too, because today's prices sit beneath projected losses [OAI26b] and a provider that must service its financing will charge more. How fast a funding shock would reach users through availability and price has not been measured. The coupling would be strongest for the third pathway and for embedded products that call frontier models, because both buy compute by the token.
At the organisational edge the evidence shows that use is shallow: daily use at 12% against 41% any use [FED26], null effects on earnings and hours two years in [HV26], and 1–5% of hours assisted [BBD24]. It does not show why. Shallow use fits a constraint in what organisations have learned to do, which dearer compute would hardly move. It fits equally well a constraint in what they can buy and what has been built for them, which a funding shock would tighten. This section's own list names two routes by which money reaches organisational learning. Young companies build many embedded products, and the embedded pathway is how organisations get depth without expertise, so when start-up funding dries up, the products that would deepen use arrive later. And practices tuned to one provider's models are stranded if that provider fails, so an organisation can lose what it has learned. Both routes act with a lag of a product cycle, not a price change, which is why the 2026 data cannot yet see them.
The two readings predict different things, which is what makes the question worth keeping open.
- Separable at the organisational edge. After a funding shock, prices and frontier releases move, but depth keeps its trend: daily use, assisted hours and firm use carry on rising, and embedded products keep shipping on cheaper and open models.
- Coupled at both edges. Depth stalls or dips a few quarters after a shock. Fewer new embedded products appear. Firms tied to a distressed provider report abandoned workflows.
Hypothesised, and no more: the clocks are coupled through the supply and price of compute; whether they are also coupled through organisational learning is undecided. Predicted: the first discriminator is whether adoption depth holds through a funding shock. The 2026 sell-offs are small natural experiments. The Census's biweekly survey runs straight through them and, on its new basis, can be read before and after each one [BTOS26]. The quarterly worker survey adds daily use [FED26]. If depth dips after a shock, the clocks are coupled at both edges. If it holds for several quarters, the separable reading gains ground, though it cannot be confirmed until the slower start-up and stranded-tooling routes have had time to act.
6 What the next four years could show
The most useful output of this essay may not be a verdict but a set of measurements that would tell the trajectories apart as they unfold. Each indicator below is chosen because the four hypotheses predict different things for it, and because a monitor independent of Harbour could read it from published sources. Lighthouse, a lean research process John runs beside Harbour with its own second-agent review [H-SB], could track them from 2027 to 2030. Harbour can investigate the two marked for it, from its own record.
| Indicator | Source | Dot-com | Breakthrough | Winter | Divided | Who |
|---|---|---|---|---|---|---|
| Hyperscaler capital spending against operating cash flow, and the debt share of AI financing | 10-Q and 8-K filings; Bank of England, BIS | rises, then breaks | falls as cash flow catches up | spending cut | stays high, returns thin | Lighthouse |
| Model-provider booked revenue and gross margin against compute spending (not run-rates) | filings where listed; otherwise flagged press | revenue holds, margins collapse | margins widen | revenue falls | revenue rises, margins stay thin | Lighthouse |
| Price for a fixed capability, and the price actually charged for a fixed workload | Epoch; provider price sheets | falls | falls | rises or stalls | falls | Lighthouse |
| Cost per verified outcome on a fixed task basket at fixed reliability, re-run quarterly | none exists; Lighthouse would build it | falls | falls fast | stalls | falls | Lighthouse |
| Task length completed at 80%, not 50%, success | METR or a successor suite | continues | accelerates | stalls | continues | Lighthouse |
| Daily use against any use; firm use by size on the new survey basis | Fed and Census surveys | keeps rising through a crash | rises | falls | rises | Lighthouse |
| Productivity of AI-exposed against unexposed industries, each against its own pre-2023 trend | BLS industry productivity with an exposure measure | divergence lags | divergence opens | none | divergence opens | Lighthouse |
| Consumer surplus against provider revenue | repeat surplus surveys; revenue | ratio jumps | ratio falls | both fall | ratio high and rising | Lighthouse |
| Compute rental prices and data-centre utilisation | rental indices; Census construction against capacity | rentals collapse, use rises | tight | idle capacity | cheap compute | Lighthouse |
| Number of providers at the frontier, and the lag of open-weight models | release logs; benchmarks | consolidation | concentration | consolidation | many and cheap | Lighthouse |
| Harbour's cost per verified change, monthly since August 2026 | Harbour's cost endpoint, once priced | — | — | — | — | Harbour |
| Share of attempted work that reaches done and survives 30 days, per dollar | Harbour's throughput measure with its cost record | — | — | — | — | Harbour |
Three rows matter most. The fourth is the series nobody publishes, and it is the one that measures what the economy is actually buying: not tokens or benchmark points but finished, checked work. The seventh is the cleanest test of delayed against small gains, because it uses each industry as its own control. The eighth is the direct measure of value created against value captured, which is the axis along which the divided economy differs from the others.
Annotated reading list
This is a selective essay, not a systematic review. Each entry gives the reference, the label it carries, what it supports here and what it does not. Every figure used was read at the source on 29 October 2026; where a source could not be opened in full, the entry says so.
The build and its financing
- [CEN26] Census Bureau, Construction Spending (C30), private construction, annual tables 2012–2025 and monthly seasonally adjusted series, release of 1 October 2026. https://www.census.gov/construction/c30/xlsx/privateha2.xlsx · https://www.census.gov/construction/c30/xlsx/privsatime.xlsx. Observed. Supports the data-centre series (2014 $1.8bn; 2025 $49.7bn; August 2026 $85.0bn annual rate against $49.1bn in August 2025) and the figure. Does not cover chips or servers; before 2014 data centres sit inside offices; monthly figures are preliminary and revised.
- [AII26] Stanford HAI, AI Index Report 2026, Economy chapter. https://hai.stanford.edu/ai-index/2026-ai-index-report/economy. Observed. Supports corporate AI investment of $14.57bn (2013) and $581.69bn (2025) and private investment of $344.66bn, up 127.5%. Built on a commercial deal database whose back-series is revised between editions; does not measure spending on compute directly.
- [STL26] Rubinton, H. and Patro, B. A. "Tracking AI's Contribution to GDP Growth." St. Louis Fed, 12 January 2026. https://www.stlouisfed.org/on-the-economy/2026/jan/tracking-ai-contribution-gdp-growth. Observed. Supports 0.97 percentage points and 39% of growth (first three quarters of 2025) against 0.81 and 28% in 2000. Does not net out imports, and the 2000 figure excludes data centres.
- [BEA26] BEA, GDP advance estimate, third quarter 2026, 29 October 2026. https://www.bea.gov/news/2026/gdp-advance-estimate-3rd-quarter-2026. Observed. Supports the import point: information-processing equipment led equipment investment and capital goods led imports. An advance estimate, revised in November.
- [GOOG26] Alphabet, Form 8-K Exhibit 99.1, Q3 2026, 28 October 2026. https://www.sec.gov/Archives/edgar/data/1652044/000165204426000080/googexhibit991q32026.htm. Observed. Supports purchases of property and equipment of $51.4bn (Q3 2026) against $24.0bn (Q3 2025), operating cash flow of $42.3bn against $48.4bn, quarterly free cash flow of $24.5bn, $24.6bn, $10.1bn, −$5.9bn and −$9.1bn from Q3 2025 to Q3 2026 (the Q3 2025 figure computed from the same statement's prior-year column), and Google Cloud revenue of $30.7bn, up 103% at an operating profit. Free cash flow is the company's own non-GAAP measure.
- [META26] Meta Platforms, Form 8-K Exhibit 99.1, Q3 2026, 21 October 2026. https://www.sec.gov/Archives/edgar/data/1326801/000162828026066700/meta-09302026xexhibit991.htm. Observed. Supports capital expenditure of $34.91bn including finance-lease principal, operating cash flow of $32.79bn, free cash flow of −$2.12bn and 2026 guidance of $135–145bn; and, from the prior-year column, $19.37bn, $30.00bn and $10.63bn for Q3 2025.
- [META26b] Meta Platforms, prospectus supplements (424B5), 28 October 2026. https://www.sec.gov/Archives/edgar/data/1326801/000119312526436410/d94886d424b5.htm · https://www.sec.gov/Archives/edgar/data/1326801/000119312526436405/d133631d424b5.htm. Observed. Supports 40 million shares at $625 by forward sale ($25bn) and $12.5bn of 6.50% mandatory convertible preferred. Does not say what the proceeds are for beyond general corporate purposes; the link to AI spending is Inferred from timing.
- [NVDA26] NVIDIA, CFO Commentary on Q2 Fiscal 2027 Results, 26 August 2026. https://www.sec.gov/Archives/edgar/data/1045810/000104581026000073/q2fy27cfocommentary.htm. Observed. Supports data-centre revenue of $89.0bn, up 117%, and a 75.0% gross margin. Does not show who the end customers are or what they earn.
- [MSFT26] Microsoft, FY26 Q4 earnings call, 29 July 2026. https://www.microsoft.com/en-us/investor/events/fy-2026/earnings-fy-2026-q4. Observed as a statement by the company's CFO: "Customer demand continues to exceed available capacity"; capital expenditure of $41bn; Azure growth of 43%. A company's account of its own demand, not an independent measure.
- [BOE26] Bank of England, Financial Policy Committee Record, September 2026. https://www.bankofengland.co.uk/financial-policy-committee-record/2026/september-2026. Observed as the committee's record; the debt totals are Morgan Stanley's and JPMorgan's estimates as the record cites them ($450bn of AI-related debt in 2026 by early September; $700bn of data-centre spending over 2026–28 from private credit; $4.1tn of debt-financed AI spending over 2026–30), and the July 2026 sell-off with no spillover to core markets. Does not give its own estimate of losses.
- [BIS26] BIS, Annual Economic Report 2026, chapter I. https://www.bis.org/publications/aer-2026/progress-peril. Observed for the hyperscaler spending and concentration figures (over $1tn across 2025–26, "outpacing earnings and the free cash flow"; the largest 30 S&P 500 stocks at 56% of the index on 26 March 2026); Inferred for its historical grouping of canal, railway, electrification and dot-com booms, which is an interpretation of other eras.
- [GS25] Goldman Sachs Global Investment Research, Top of Mind issue 143, "AI: in a bubble?", October 2025. https://www.goldmansachs.com/pdfs/insights/goldman-sachs-research/ai-in-a-bubble/report.pdf. Inferred: a sell-side house view. Supports the valuation comparison (median 24-month forward P/E of 25 for the seven largest US technology stocks, about half the dot-com equivalent), AI investment below 1% of US GDP against 1.5–2% and 2–5% for earlier booms, and the "80% debt and 20% equity" remark. A year old; does not cover 2026's cash-flow turn.
- [SEQ24] Cahn, D. "AI's $600B Question." Sequoia Capital, 20 June 2024. https://www.sequoiacap.com/article/ais-600b-question/. Inferred: an investor's back-of-envelope calculation. Supports the method (Nvidia revenue doubled for data-centre cost, doubled again for margin) and the view that losses fall "primarily to investors". Does not measure revenue.
- [OAI26a] Reuters, "OpenAI CFO says annualized revenue crosses $20 billion in 2025", 19 January 2026. https://finance.yahoo.com/news/openai-cfo-says-annualized-revenue-173519097.html. Observed as a company statement reported by Reuters: over $20bn annualised in 2025 against $6bn in 2024; compute 1.9GW against 0.6GW. Unaudited; annualised, not booked.
- [OAI26b] Reuters, citing the Financial Times, "OpenAI forecasts cash burn near $280 billion by 2030", 19 September 2026. https://www.thestar.com.my/tech/tech-news/2026/09/19/openai-forecasts-cash-burn-near-280-billion-by-2030-ft-reports. Predicted by the company in a presentation the FT saw: $278bn of cash burn over 2026–30, about $856bn of compute spending, revenue from $36bn (2026) to $350bn (2030). Second-hand reporting of a private projection.
- [ANT26] Anthropic, Series H announcement, 28 May 2026. https://www.anthropic.com/news/series-h. Observed as a company statement: $65bn raised at $965bn post-money; run-rate revenue above $47bn. Unaudited.
- [CHW03] Couper, E. A., Hejkal, J. P. and Wolman, A. L. "Boom and Bust in Telecommunications." Richmond Fed Economic Quarterly 89(4), 2003, 1–24. https://www.richmondfed.org/-/media/RichmondFedOrg/publications/research/economic_quarterly/2003/fall/pdf/wolman.pdf. Observed, another era. Supports communications-equipment investment from about $62bn to over $135bn a year (1996 dollars, 1996–2000), the fall to 4.8% of private investment by 2002, and the authors' rejection of the "bubble that burst" reading. A mechanism to consider for AI, not an estimate of it.
Value created and captured
- [NOR04] Nordhaus, W. D. "Schumpeterian Profits in the American Economy: Theory and Measurement." NBER Working Paper 10433, 2004. https://www.nber.org/papers/w10433. Observed, another era: "only a minuscule fraction" of the social returns from technological advances over 1948–2001 was captured by producers. The abstract was read; the paper's own percentage could not be extracted from the PDF and is not used. About the whole economy, not AI.
- [BCE26] Brynjolfsson, E., Collis, A., Eggers, F., Kazinnik, S. and Nguyen, D. "What is Generative AI Worth?" Stanford Digital Economy Lab, 13 April 2026. https://digitaleconomy.stanford.edu/publication/what-is-generative-ai-worth/. Observed as a stated-preference measurement: US consumer surplus of $116bn (2025) and $172bn (2026); 98 to 115 million users; mean monthly valuation $98 to $124.50, median $3.40 to $11.40; "substantially exceeds" US generative-AI revenue. Stated, not revealed, preferences; a working paper.
Productivity
- [BLR23] Brynjolfsson, E., Li, D. and Raymond, L. "Generative AI at Work." NBER Working Paper 31161, 2023; Quarterly Journal of Economics 140(2), 2025. https://www.nber.org/papers/w31161 · https://doi.org/10.1093/qje/qjae044. Observed. Supports 5,179 agents, 14% more issues resolved per hour, 34% for novice and low-skilled workers (working-paper figures; the published version reports a slightly different average). One firm, one occupation.
- [METR25] METR, early-2025 study of experienced open-source developers, 10 July 2025. https://metr.org/blog/2025-07-10-early-2025-ai-experienced-os-dev-study/. Observed. Supports the 19% slowdown for experienced developers on their own repositories, against their expectation of a speed-up. A small sample of one kind of developer.
- [METR26] METR, uplift update, 24 February 2026. https://metr.org/blog/2026-02-24-uplift-update/. Observed. Supports the 2026 estimates (57 developers, over 800 tasks; 18% and 4% less time, with their intervals) and METR's own description of them as "only very weak evidence". Selection into the study, as developers refuse to work without AI, is the stated problem.
- [HV26] Humlum, A. and Vestergaard, E. "Still Waters, Rapid Currents: Early Labor Market Transformation under Generative AI." NBER Working Paper 33777, revised 2026. https://www.nber.org/papers/w33777. Observed. Supports precise nulls on earnings and hours, ruling out effects above 2% two years after ChatGPT, in Denmark. Wages and hours, not output; one country.
- [ACE24] Acemoglu, D. "The Simple Macroeconomics of AI." NBER Working Paper 32487; Economic Policy 40(121), 2025. https://www.nber.org/papers/w32487 · https://doi.org/10.1093/epolic/eiae042. Hypothesised: a calibrated model. Supports a ten-year TFP gain of no more than 0.66%, under 0.53% adjusted. Depends on its exposure and cost-saving inputs; excludes new products.
- [BBD24] Bick, A., Blandin, A. and Deming, D. J. "The Rapid Adoption of Generative AI." NBER Working Paper 32966. https://www.nber.org/papers/w32966. Observed (survey). Supports nearly 40% adult use, 23% weekly and 9% daily work use (late 2024), 1–5% of hours assisted and 1.4% of hours saved. Self-reported.
- [BLS26] BLS, Productivity and Costs, second quarter 2026, revised, 3 September 2026. https://www.bls.gov/news.release/prod2.nr0.htm. Observed. Supports 2.1% annualised growth since Q4 2019, the same as the rate since 1947. Says nothing about cause.
- [BRS21] Brynjolfsson, E., Rock, D. and Syverson, C. "The Productivity J-Curve." AEJ: Macroeconomics 13(1), 2021, 333–72. https://doi.org/10.1257/mac.20180386. Hypothesised as a mechanism, with one Observed estimate (TFP 15.9% above official measures by 2017 after adjusting for computer-related intangibles). Does not show that AI will follow the curve.
- [DAV90] David, P. A. "The Dynamo and the Computer." AER 80(2), 1990, 355–361. https://gwern.net/doc/economics/automation/1990-david.pdf. Hypothesised as a mechanism, from another century. Used for the argument only: electrification raised productivity after factories were reorganised. The scan could not be read as text in this session; no figure from it is used, and the predecessor essay [H-LWT] gives its reading.
- [OS00] Oliner, S. D. and Sichel, D. E. "The Resurgence of Growth in the Late 1990s: Is Information Technology the Story?" FEDS 2000-20. https://www.federalreserve.gov/pubs/feds/2000/200020/200020abs.html. Observed, another era: IT accounted for about two-thirds of the one-point step-up in productivity growth in the late 1990s. Says nothing about AI's timing.
- [CH10] Comin, D. and Hobijn, B. "An Exploration of Technology Diffusion." AER 100(5), 2010, 2031–59. https://doi.org/10.1257/aer.100.5.2031. Observed, other eras: fifteen technologies, 166 countries, an average adoption lag of 45 years. Lags between countries, not within one.
- [ELO23] Eloundou, T., Manning, S., Mishkin, P. and Rock, D. "GPTs are GPTs." arXiv 2303.10130; Science 384, 2024. https://arxiv.org/abs/2303.10130. Hypothesised: an exposure estimate (80% of workers with at least 10% of tasks exposed, 19% with at least half; 15% of tasks faster with a model alone, 47–56% with model-powered software). Exposure is not adoption; no timeline.
Adoption
- [FED26] Federal Reserve Board, "Monitoring AI Adoption in the U.S. Economy." FEDS Notes, 3 April 2026. https://www.federalreserve.gov/econres/notes/feds-notes/monitoring-ai-adoption-in-the-u-s-economy-20260403.html. Observed. Supports work use of about 41% (40.7%, up 9.7 points in a year) and daily use of about 12% (up 2.9 points) in November 2025, employment-weighted firm adoption of about 78% in the Atlanta Fed survey, BTOS at about 18% at the end of 2025, and the question change. The best single source on breadth against depth; draws no productivity conclusion.
- [BTOS26] Census Bureau, story on AI use among businesses, May 2026. https://www.census.gov/library/stories/2026/05/ai-use-businesses.html. Observed. Supports 19.8% of businesses (3 May 2026), 17–20% from December 2025 to May 2026, 37% of firms with 250 or more employees, and the November 2025 change of wording. The legacy and new series cannot be joined.
- [CHA25] Chatterji, A. et al. "How People Use ChatGPT." NBER Working Paper 34255, 2025. https://www.nber.org/papers/w34255. Observed: non-work messages from 53% to more than 70% (November 2022 to July 2025). Consumer plans of one provider.
- [AEI25] Anthropic, "Anthropic Economic Index: geography report", 15 September 2025. https://www.anthropic.com/research/economic-index-geography. Observed for one provider's traffic: directive conversations from 27% to 39%; automation 49.1% against augmentation 47%; 77% of API conversations showing automation. Not representative of the economy; the vendor classifies its own conversations.
Capability and its cost
- [EPO25] Epoch AI, "LLM inference prices have fallen rapidly but unequally across tasks", 12 March 2025. https://epoch.ai/data-insights/llm-inference-price-trends. Observed. Supports falls of 9 to 900 times a year, 40 times for GPT-4-level performance on graduate science questions, over about three years. Published prices per token, not providers' costs; Epoch says the fastest falls are the least certain to persist.
- [METR-H] METR, "Measuring AI Ability to Complete Long Tasks", 19 March 2025, and "Time Horizon 1.1", 29 January 2026. https://metr.org/blog/2025-03-19-measuring-ai-ability-to-complete-long-tasks/ · https://metr.org/blog/2026-01-29-time-horizon-1-1/. Observed. Supports the 50% horizon doubling about every seven months over six years, the 2026 doubling times (196.5, 130.8 and 88.6 days for the full period, since 2023 and since 2024) and the 320-minute estimate with its interval. Software tasks; 50% success; only five of 31 long tasks timed against humans; no 80% figures in the text; no cost data.
- [KAP24] Kapoor, S., Stroebl, B., Siegel, Z. S., Nadgir, N. and Narayanan, A. "AI Agents That Matter." arXiv 2407.01502. https://arxiv.org/abs/2407.01502. Hypothesised as a method: agents should be optimised for cost and accuracy jointly. Does not supply a series.
The Harbour papers
Every Harbour figure is read from a paper already in the archive, at commit c5245296; this
essay takes no new measurement. They describe one operator's system and support nothing about
the wider economy.
- [H-LWT] learning-while-the-tools-change.md, lines 84 and 90–140. Inferred. The predecessor: three clocks, adoption as a distribution across cohorts, and the clocks' dependence on each other. Its reading of David [DAV90] is the one relied on here.
- [H-TGT] tasks-generate-tasks.md, lines 15–21. Observed, for Harbour. 1,484 created against 701 closed in sixty days; 52% of generated tickets never worked.
- [H-RTR] root-task-ratio.md, lines 15–23 and 37–38. Observed, for Harbour. Units that reached done caused 1.52 further units; the rest 0.18; three in four caused none.
- [H-NWP] never-worked-pile.md, lines 15–23. Observed, for Harbour, one reader: 34 of 40 never-worked filings still true, 38 clearly stated, 23 the parent's own scope.
- [H-MT] measuring-throughput.md, lines 15–24. Observed, for Harbour. Used in Next for its definition of a correct, complete change: merged with its ticket done, no escaped fault traced to it within 30 days, none of its work filed as a follow-up. Its weekly counts (about 95 in June, 47 from mid-July) are not used as evidence about cost: they come from a different period from the capacity findings, and Harbour's own analysis attributes the fall to a change of regime, not to the models.
- [H-CC] cheaper-capacity.md, lines 14–27. Observed for the benchmark and price comparisons, Predicted for the capacity multiple; untried on a real ticket, as the paper says.
- [H-CI] cheap-implementer.md, line 13. Observed, for Harbour, thirteen tickets: "the review is the cost".
- [H-VER] what-lowers-the-verification-cost.md, line 13. Inferred: a literature reading that verification is the named gate on autonomy.
- [H-PROP]
docs/papers/proposals.md, line 33. Observed, for Harbour: the cost per verified task reads empty because the price table lacks rows for the models now in use. - [H-SB]
docs/steady-base.md, line 137. Observed, for Harbour: Lighthouse is a lean research process with a second-agent review.
Next
The essay leaves four questions that evidence could answer, and puts them in proposals.md.
- What does a verified outcome cost, and is it falling? No public series measures the cost of getting a piece of work done, checked and accepted, though it is the quantity the economy is buying. Lighthouse could build one: a fixed basket of verifiable tasks with hidden acceptance tests, re-run each quarter on the then-current models at then-current prices, reporting cost per accepted result at a fixed success rate. Kept independent of Harbour, it would separate the price of capability from the price of useful work through 2027–2030 and tell the trajectories in section 5 apart on the axis that matters most.
- Do AI-exposed industries pull away from their own trends? The cleanest test of delayed against small gains. Pair BLS industry productivity with an exposure measure and track each industry against its pre-2023 trend, quarterly; a Lighthouse series, not a Harbour one.
- Does adoption depth hold through a funding shock? The first test of whether the financial and diffusion timelines are separable at the organisational edge (section 5). Read the Census's biweekly firm survey on its new basis, and the quarterly worker survey's daily use, before and after the 2026 sell-offs and any later shock, and keep reading for several quarters, since the start-up and stranded-tooling routes act with a lag; a Lighthouse series.
- Does Harbour's agent fleet raise valuable work, or only work? Its papers show more work attempted, a minority finished, and finished work generating more than it closes, but never measured value per attempt. Join the throughput measure (changes that merged, passed review and survived 30 days) [H-MT] to the cost record, monthly since August 2026, once the missing price rows exist, and report correct, complete changes per API-equivalent dollar and the share of generated tickets that reach that bar.
The remaining indicators in section 6 can be tracked from published sources without a new paper. This essay's version 1 is not independently checked; a check of its figures against their sources would be welcome. The claims most worth attacking are the layer placements in section 5 and the directions given in section 4.